Another Record-Setting Month for Canadian Housing

Latest News Kim Stenberg 15 Sep

Today’s release of August housing data by the Canadian Real Estate Association (CREA) showed a blockbuster August with both sales and new listings hitting their highest levels in 40 years of data–exceeding the record July activity levels. This continues the rebound in housing that began four months ago.

National home sales rose a further 6.2% on a month-over-month (m-o-m) basis in August, raising them to another new all-time monthly record (see chart below).

Unlike the previous two months in which activity was up right across the country, sales in August were up in about 60% of local markets. Gains were led by the Greater Toronto Area (GTA) and British Columbia’s Lower Mainland. With ongoing supply shortages in so many parts of Canada, it is interesting to note that the GTA and Lower Mainland also saw a considerable amount of new supply become available in August.

Actual (not seasonally adjusted) sales activity posted a 33.5% y-o-y gain in August. It was a new record for the month of August, and the sixth-highest monthly sales figure of any month on record. Transactions were up compared to last August in almost all Canadian housing markets.

So far this year, over 340,000 homes have traded hands over the Canadian MLS Systems, which was up 0.8% from the same period in 2019 despite the COVID-19 pandemic-induced recession.

“It has been a record-setting summer in many housing markets across Canada as REALTORS® and their clients play catch up following the loss of so much of the 2020 spring market,” stated Costa Poulopoulos, Chair of CREA. “Many markets dealing with inventory shortages have been seeing fierce competition among buyers this summer; although, that was something that had been anticipated for 2020 prior to COVID-19. It really does seem that the spring market shifted into the summer”.

According to Shaun Cathcart, CREA’s Senior Economist, “Activity shows signs of moderating in September”.

New Listings

The number of newly listed homes posted a further 10.6% gain in August compared to July. New supply was up in close to three-quarters of local markets, led by gains in the Lower Mainland, GTA and Ottawa.

With the August increase in new supply outpacing the rise in sales for the first time since the rebound began in May, the national sales-to-new listings ratio eased to 69.4% in August compared to 72.3% posted in July. That said, it was still among the highest levels on record for this measure.

Based on a comparison of sales-to-new listings ratio with long-term averages, only about a third of all local markets were in balanced market territory, measured as being within one standard deviation of their long-term average. The other two-thirds of markets were above long-term norms, in many cases well above.

The number of months of inventory is another important measure of the balance between sales and the supply of listings. It represents how long it would take to liquidate current inventories at the current rate of sales activity.

There were just 2.6 months of inventory on a national basis at the end of August 2020 – the lowest reading on record for this measure. At the local market level, a number of Ontario markets are now into weeks of inventory rather than months. So supply constraints are still prevalent in many parts of the country, especially in Ontario.

Home Prices

The Aggregate Composite MLS® Home Price Index (MLS® HPI) rose by 1.7% m-o-m in August 2020 (see chart and table below). This compares to a 2.3% m-o-m jump in July 2020 – the second largest increase on record (after March 2017) going back 15 years. Of the 21 markets currently tracked by the index, m-o-m gains were posted everywhere but Victoria and elsewhere on Vancouver Island.

The non-seasonally adjusted Aggregate Composite MLS® HPI was up 9.4% on a y-o-y basis in August – the biggest gain since late 2017.

The largest y-o-y gains were recorded in Ottawa (+19.9%) and Montreal (+16.4%), followed by increases in the 10% – 15% range in the GTA and surrounding Greater Golden Horseshoe markets. Moncton prices were also up in that range in August.

Prices were fairly flat on a y-o-y basis in Calgary, Edmonton and St. John’s, while climbing in the 3.5% – 5.5% range across B.C.

The MLS® HPI provides the best way to gauge price trends because averages are strongly distorted by changes in the mix of sales activity from one month to the next.

The actual (not seasonally adjusted) national average home price set another record in August 2020 at more than $586,000, up 18.5% from the same month last year.

Bottom Line

CMHC forecasted back in May that the national average sales prices will fall 9%-to-18% in 2020 and not return to yearend-2019 levels until as late as 2022. Instead, the national average sales price as of August has posted a 18.5% gain.

Housing strength is largely attributable to pent-up demand by households that have maintained their level of income during the pandemic. The hardest-hit households are low-wage earners in the accommodation, food services, and travel sectors. These are the folks that can least afford it and typically are not homeowners.

The good news is that the housing market is contributing to the recovery in economic activity.  


CMHC Annual Residential Mortgage Industry Report

The Residential Mortgage Industry report provides an in-depth view of the residential mortgage market in Canada: from mortgage origination to funding, covering insured and uninsured mortgages, and encompasses activity from all mortgage lender types. It is based on data available at the end of the second quarter of 2020. The following are key highlights:

Mortgage lender type trends

  • The report shows that in 2019, Canada’s big six banks maintained their strong foothold in the housing finance market, with a 67% market share of newly extended mortgages (see chart below).
  • Mortgage Finance Companies (MFCs) hold 20% of the insured mortgage space and credit unions stand at 12%.
  • Mortgage delinquencies of 90 days or more remained at low levels for all mortgage lender types, which suggests that a steady share of mortgage holders continued to be able to make their payments or were able to defer their mortgage payments.
  • MICs continued to represent 1% in nationwide outstanding mortgages, valued at approximately between $14 billion and $15 billion in mortgage debt.
  • Some MICs offered mortgage deferrals and other types of accommodations to financially strained mortgage consumers. An estimated 10% of mortgage consumers asked for a mortgage deferral.

Mortgage Funding Trends

  • Deposits continued to be the primary source of mortgage funding for the big six banks (66%) and credit unions (77%).
  • Covered bonds made up 17% of total mortgage funding for Canada’s big six banks at the end of the first quarter of 2020, representing an increase of 4% from 2019.
  • Private securitization continued to account for a very small share of the mortgage funding mix in Canada, with just 1.1%. However, the residential mortgage-backed securities market appears to be expanding.


Author:  Dr. Sherry Cooper, Chief Economist – Dominion Lending Centres
Sherry is an award-winning authority on finance and economics with over 30 years of bringing economic insights and clarity to Canadians.

Strong August Jobs Report in Canada

Latest News Kim Stenberg 4 Sep

Canada Has Recouped Two-Thirds Of Pandemic Job Losses

The August Labour Force Survey, released this morning by Statistics Canada, reflects labour market conditions as of the week of August 9 to 15, five months after the onset of the COVID-19 economic shutdown. By mid-August, public health restrictions had substantially eased across the country and more businesses and workplaces had re-opened.

Employment rebounded in August by 246,000 net new jobs, a slowdown from the 419,000 gain in July and June’s 953,000 rise. This slowdown was expected with the initial recovery boost from easing containment measures in the spring fading through the summer.

The great news is that 84% of the headline jobs gain in August was in full-time positions. This follows the surge in part-time jobs in July. Full-time employment stood at 93.9% of pre-pandemic levels in August, compared with 96.1% for part-time work. In the months prior to the COVID-19 economic shutdown, full-time employment had reached record highs, while growth in part-time work was relatively flat. Compared with 12 months earlier, full-time employment was down 5.4% in August, while part-time work decreased by 5.1%. And an elevated share of those working part-time is doing so despite preferring full-time work. Hours worked increased more than employment in August–but are still down more relative to pre-shock February levels (-8.6%) than the headline employment count (-5.7%).

The August job growth brought employment to within 1.1 million of its pre-COVID February level, thereby recouping two-thirds of all the lost jobs.

The number of Canadians who were employed but worked less than half their usual hours for reasons likely related to COVID-19 fell by 259,000 (-14.6%) in August. Combined with declines in May, June and July, this left COVID-related absences from work at 713,000 (+88.3%) above February levels.

As of the week of August 9 to 15, the total number of Canadian workers affected by the COVID-19 economic shutdown stood at 1.8 million. In April, this number reached a peak of 5.5 million, including a 3.0 million drop in employment and a 2.5 million increase in COVID-related absences from work.

The number of Canadians working from home declined for the fourth consecutive month. In April, at the height of the COVID-19 economic shutdown, 3.4 million Canadians who worked their usual hours had adjusted to public health restrictions by beginning to work from home. This number has fallen each month since May when the gradual easing of public health restrictions began and reached 2.5 million in August.

Among Canadians who worked their usual hours in August, the total number working from home fell by nearly 300,000 compared with July, while the number working at locations other than home increased by almost 400,000.

THE JOBLESS RATE CONTINUED TO FALL IN AUGUST

The unemployment rate fell 0.7 percentage points to 10.2% in August. As a result of the COVID-19 economic shutdown, the unemployment rate had surged from 5.6% in February to a record high of 13.7% in May. By way of comparison, during the 2008/2009 recession, the unemployment rate rose from 6.2% in October 2008 and reached a peak of 8.7% in June 2009. It took approximately nine years before it returned to its pre-recession rate.

The unemployment rate fell most sharply in August among core-aged women aged 25 to 54 years old, down 1.2 percentage points to 7.5%, the lowest unemployment rate among all major groups. This decline was largely due to employment increases, as overall labour force participation was unchanged from July. The unemployment rate for core-aged men fell 0.7 percentage points to 8.1%, also the result of increased employment, with little change in their labour market participation.

Employment gains in the services sector continued to outpace that of the goods-producing sector. Employment growth in the services sector was driven by gains in educational services, accommodation and food services and the “other services” industry. In the goods sector, gains in manufacturing were partially offset by declines in natural resources.

Accommodation and food services as well as retail trade were among the industries hardest hit by the initial COVID-19 economic shutdown. By April, employment had fallen to half (-50.0%) of its pre-pandemic level in accommodation and food services and to 77.1% of its pre-COVID-19 level in retail trade. Starting in May, employment rebounded in both sectors as many provinces began reopening their economy.

Employment growth in accommodation and food services rose by 18.4% per month on average from May to July. In August, however, the pace of growth in the industry slowed to 5.3% (+49,000). Despite these recent gains, employment in accommodation and food services was at 78.9% of its February level. August marked the fifth full month of international travel restrictions, which continues to affect industries with strong ties to tourism.

The number of people employed in retail trade edged up 0.7% (+14,000) in August, following average monthly increases of 6.3% over the previous three months. Employment in retail trade reached 93.4% of its pre-COVID-19 level but fell just below the rate of recovery for total employment (94.3%).

While employment remained below pre-COVID-19 levels, retail sales in June were higher than in February and are expected to continue to rise in July, based on preliminary estimates. This highlights potential structural changes within the industry as employers have been able to increase their sales despite a smaller workforce.

Employment Increased in Most Provinces in August–Led by Ontario and Quebec

Employment in Ontario rose by 142,000 in August (+2.0%), nearly all in full-time work, while the unemployment rate fell by 0.7 percentage points to 10.6%. Combined with the employment increases in June and July (+529,000), the gains in August brought employment in Ontario to within 93.6% of its pre-pandemic level.

In the census metro area (CMA) of Toronto, employment increased by 121,000 (+3.8%), nearly double the growth rate of the province, and reached 93.3% of its pre-pandemic level.

In Quebec, employment increased by 54,000 (+1.3%) in August, building on gains of 576,000 over the previous three months, and bringing employment in the province to within 95.7% of its pre-COVID level.

In the Montréal CMA, employment grew by 38,000 (+1.8%) in August and reached 96.0% of its pre-pandemic level.

Employment rose in most Western provinces in August. British Columbia reported the largest increase, up 15,000 (+0.6%). Employment reached 94.1% of its February level and the unemployment rate fell 0.4 percentage points to 10.7%.

While employment in Alberta was little changed, the unemployment rate declined by a full percentage point to 11.8% as fewer people looked for work.

In Atlantic Canada, Nova Scotia had the largest employment gain in August, up 7,200 (+1.6%), mostly in part-time work. The unemployment rate was little changed at 10.3%, as more Nova Scotians participated in the labour market. After notable increases in May and June, employment in New Brunswick held steady for the second consecutive month.

Bottom Line 

This was still a relatively strong employment report even though job gains have slowed. Canada’s employment recovery has outpaced the US, recouping two-thirds of the lost jobs compared to only a 50% gain south of the border. The hardest-hit has been both low-wage workers and youth, which helps to explain why housing activity has been so strong. Low-wage employees and youth are typically not homebuyers or sellers. Moreover, consumer spending in Canada has solidified very near to pre-COVID levels. Spending on entertainment, dining and self-care has risen recently as more businesses open up and is now approaching year-ago levels. Total credit or debit card spending is up about 5% relative to the same time last year. Canadians are venturing out more around their home towns, but not going much further.

According to RBC:

  • “While online spending remained prevalent in some areas (e.g., groceries), in-person transactions continued to recover.
  • Spending indicates Canadians were comfortable going out to dinner, even if to a patio. Restaurant spending was buoyed by Canadians seeking in-person dining experiences and was down just over 4% from last year’s level.
  • The share of online transactions at restaurants decreased to 17% from one-third at its post-crisis peak.
  • Health and self-care spending increased through mid-August, as gym reopening’s led to an uptick in fitness spending.
  • Entertainment spending picked up further into August and was down 10% relative to last year.
  • Spending was supported by still-strong spending on golf and to a lesser degree digital goods.
  • More recently, Canadians began spending again on professional sports, lotteries, hobbies, and local attractions.”

Recent data from the local real estate boards in Toronto and Vancouver showed strong sales activity and significant further upward pressure on prices. The CREA data for the whole country will be out on the 15th of September. This adjusts the price data for types of homes sold, giving us a better idea of how significant price pressures have been. 


Author:  Dr. Sherry Cooper, Chief Economist – Dominion Lending Centres
Sherry is an award-winning authority on finance and economics with over 30 years of bringing economic insights and clarity to Canadians.

Canadian Q2 GDP Growth Plunge-Rebounds Since April

Latest News Kim Stenberg 28 Aug

Canadian Economy Took a Record Nosedive in Q2

Canadian real GDP plunged 11.5% in the second quarter, or -38.7% at an annualized rate, the worst quarterly decline on record (see chart below). This followed an 8.2% plunge in Q1. The worst of the contraction occurred early in the quarter as the lockdown in March and April wreaked havoc on activity. Since then, the economy has shown surprisingly strong signs of recovery.

StatsCan revealed today that GDP rose 6.5% in June following the 4.8% rise in May and an estimated 3.0% growth in July. Even so, Canada’s recovery is expected to be bumpy and long. No doubt, not all businesses and sectors will expand in sync, and not all jobs will be recovered.

One of the brightest spots in the recovery has been housing, where activity surged in July, reflective of record-low mortgage rates and pent-up demand. Apparently, many homebound Canadians are reassessing their housing needs. Demand for increased space, especially in the suburbs or exurbs, has been robust.

Virtually every sector of the economy was battered in Q2. Household spending dived 43% while business investment collapsed at a 57% annual rate. Virus containment weighed on both, with a fall in oil prices exacerbating the decline in oil & gas investment. Net exports were the only sector that added to economic activity, but only because imports fell more than exports as housebound consumers and shuttered businesses had little need for imported products.

On a year-over-year basis, the monthly rise in June and July will leave GDP down a much milder 5%, but still worse than the -4.7% drop during the financial crisis. The surge in June–itself a record bounce–reflects the gradual re-opening of the economy, with retail, wholesale and manufacturing leading the way. Retail trade jumped 22.3% in June, surpassing its pre-pandemic level of activity. Motor vehicle dealers contributed most to growth.

Following a 17.3% jump in May, the construction sector rose 9.4% in June as a continued easing of emergency restrictions across the country contributed to the return to nearly normal levels of activity at construction sites. Residential construction grew 7.1% as increases in multi-unit dwellings construction and home alterations and improvements more than offset lower single-unit construction. Non-residential construction rose 11.0%, surpassing the pre-pandemic level of activity, as all three components were up.

Real estate and rental and leasing grew 2.5% in June. Activity at the offices of real estate agents and brokers jumped 65.2% in the month, following a 56.4% increase in May, as home resale activity in all major urban centres saw double-digit increases. The output of real estate agents and brokers was about 7% below February’s pre-pandemic level, but other data show it was up sharply in July, hitting new record highs.

GOVERNMENT PROVIDED A MUCH-NEEDED CUSHION 

Household disposable income surged last quarter despite the pandemic thanks to government income support (see chart below). The rise in income, coupled with the massive decline in consumer spending as well as the deferral of mortgage payments for many triggered a surge in the savings rate. The household saving rate jumped to 28.2% from 7.6% in the prior quarter. Savings rates, of course, are generally higher for higher income brackets.

BOTTOM LINE

The plunge in economic activity in the second quarter–though awful–was not as deep as the Bank of Canada expected (-43%) in its most recent Monetary Policy Report. As well, the rebound since the end of April has been stronger than expected, especially in the housing sector. To be sure, labour market conditions are still very soft with the jobless rate at 10.9% in July, but the new programs announced last week by the federal government to replace CERB will help ease the transition for people still looking for work.

A possible resurgence in the virus remains a risk unless an effective vaccine can be distributed. The economy will operate below capacity into the next year, but perhaps not as drastically below capacity as previously feared.


Author: Dr. Sherry Cooper, Chief Economist – Dominion Lending Centres
Sherry is an award-winning authority on finance and economics with over 30 years of bringing economic insights and clarity to Canadians.


Record-Setting Canadian Housing Market in July

Latest News Kim Stenberg 17 Aug

Today’s release of July housing data by the Canadian Real Estate Association (CREA) showed a blockbuster July with both sales and new listings hitting their highest levels in 40 years of data. This continues the rebound in housing that began three months ago.

National home sales rose 26% month-over-month (m-o-m) in July, which translates to a 30.5% gain from a year ago (see chart below). July’s sales activity was the strongest for any month in history. According to Shaun Cathcart, CREA’s Senior Economist,  “A big part of what we’re seeing right now is the snapback in activity that would have otherwise happened earlier this year. Recall that before the lockdowns, we were heading into the tightest spring market in almost 20 years. Things may have gone quiet for a few months, but ultimately the market we’re seeing right now is mostly the same one we were heading into back in March. That said, there are some new factors at play as well. There are listings that will come to the market because of COVID-19, but many properties are also not being listed right now due to the virus, as evidenced by inventories that are currently at a 16-year low. Some purchases will no doubt be delayed, but the new-found importance of home, lack of a daily commute for many, a desire for more outdoor and personal space, room for a home office, etc. will certainly also spur activity that otherwise would not have happened in a non-COVID-19 world.”

For the third month in a row, transactions were up on a month-over-month basis across the country. Among Canada’s largest markets, sales rose by 49.5% in the Greater Toronto Area (GTA), 43.9% in Greater Vancouver, 39.1% in Montreal, 36.6% in the Fraser Valley, 31.8% in Hamilton-Burlington, 28.7% in Ottawa, 16.9% in London and St. Thomas, 15.7% in Calgary, 12.1% in Winnipeg, 9.7% in Edmonton and 5.4% in Quebec City.

New Listings

The number of newly listed homes climbed by another 7.6% in July compared to June, to a level of 71,879–the highest level for any July in history. New supply was only up in about 60% of local markets, as the rebound in supply appears to be tapering off in many parts of the country. The national increase in July was dominated by gains in the GTA. More supply is expected to come on the market in future months, particularly once a vaccine is widely available.

With the ongoing rebound in sales activity now far outpacing the recovery in new supply, the national sales-to-new listings ratio tightened to 73.9% in July compared to 63.1% posted in June. It was one of the highest levels on record for this measure, behind just a few months back in late 2001 and early 2002.

Based on a comparison of sales-to-new listings ratios with long-term averages, only about a third of all local markets were in balanced market territory, measured as being within one standard deviation of their long-term average, in July 2020. The other two-thirds of markets were all above long-term norms, in many cases well above.

The number of months of inventory is another important measure of the balance between sales and the supply of listings. It represents how long it would take to liquidate current inventories at the current rate of sales activity.

Housing markets are very tight, especially in Ontario, as demand has far outpaced supply. There were just 2.8 months of inventory on a national basis at the end of July 2020 – the lowest reading on record for this measure. At the local market level, a number of Ontario markets shifted from months of inventory to weeks of inventory in July.

Home Prices

The Aggregate Composite MLS® Home Price Index (MLS® HPI) jumped by 2.3% m-o-m in July 2020 – the second largest increase on record (after March 2017) going back 15 years. (see Table below). Of the 20 markets currently tracked by the index, they all posted m-o-m increases in July.The biggest m-o-m gains, in the range of 3%, were recorded in the GTA outside of the city of Toronto, Guelph, Ottawa and Montreal; although, generally speaking, most markets east of Saskatchewan are seeing prices accelerate in line with strong sales numbers. Price gains were more modestly positive in B.C. and Alberta.

The non-seasonally adjusted Aggregate Composite MLS® HPI was up 7.4% on a y-o-y basis in July the biggest gain since late 2017.

The MLS® HPI provides the best way to gauge price trends because averages are strongly distorted by changes in the mix of sales activity from one month to the next.

The actual (not seasonally adjusted) national average price for homes sold in July 2020 was a record $571,500, up 14.3% from the same month last year.

The national average price is heavily influenced by sales in the Greater Vancouver and the GTA, two of Canada’s most active and expensive housing markets. Excluding these two markets from calculations cuts around $117,000 from the national average price. The extent to which sales continue to fluctuate in these two markets relative to others could have further compositional effects on the national average price, both up and down.

Bottom Line

CMHC has recently forecast that national average sales prices will fall 9%-to-18% in 2020 and not return to yearend-2019 levels until as late as 2022. I continue to believe that this forecast is overly pessimistic. Here we are in the second half of 2020, and the national average sales price has risen 14.3% year-over-year.

The good news is that the housing market is contributing to the recovery in economic activity. While the course of the virus is uncertain, Canada’s government has handled the COVID-19 situation very well from both a public health and a fiscal and monetary perspective. The future course of the economy here will depend on the virus. While no one knows what that will be, suffice it to say that Canada’s economy is en route to a full recovery, but it may well be a long and bumpy one.


Author: Dr. Sherry Cooper
Chief Economist, Dominion Lending Centres
Sherry is an award-winning authority on finance and economics with over 30 years of bringing economic insights and clarity to Canadians.


COVID Supercharges Canadian Housing Market, Yet CMHC Still Gloomy

Latest News Kim Stenberg 12 Aug

Pandemic Triggers Red-Hot Summer Housing Market

We will get the full story on July housing in Canada when the Canadian Real Estate Association releases its July data in the next few days, but local real estate boards have reported a robust July market. Even in Calgary, year-over-year sales have jumped by double digits. Sales in Montreal were up more than 45% y-o-y, while Ottawa and the GTA were also very strong. Out west, Vancouver and other hot spots in BC saw the results of pent up activity, from both homebuyers and sellers, that had been accumulating over the past year.

Remember, had it not been for the pandemic, a record spring sales season was in the cards. The lockdown postponed that strength, with sales jumping sharply in May, June and July. Supply continues to remain limited relative to demand, and the Bank of Canada is looking towards housing as a leading sector in the recovery.

Record-low interest rates have boosted affordability everywhere. The Bank of Canada has made it clear that interest rates will remain low for an extended period. Mortgage rates have fallen, as have interest rates on home equity lines of credit. Even five of the Big Six banks have cut their advertised 5-year fixed mortgage rates (posted rates) by about 15 basis points to 4.79%.

These rates have been very sticky on the downside, as banks are reluctant to cut posted rates, which are is used to calculate the penalty for breaking a mortgage. Indeed, the gap between the posted rate and the 5-year government of Canada bond yield is historically wide. So is the gap between posted rates and actual contract mortgage rates at the very same banks.

The Bank of Canada posted rate is the qualifying rate for the mortgage stress test for insured and uninsured mortgages at the federally-regulated lenders–the so-called B-20 rule. That qualifying rate is set to fall from its current level of 4.94% to 4.79% later today when the central bank is due to update its figure. 

Last February, following months of pressure from the real estate industry, the Department of Finance and the federal banking regulator announced they would rejig the “floor” of stress tests that borrowers must pass to qualify for insured and uninsured home loans. Then came COVID-19, and a sweeping government rescue that included regulatory relief for lenders. As part of the response, the change to the stress test, which was planned for April, was suspended indefinitely.

Last month, the Office of the Superintendent of Financial Institutions announced it would “gradually restart” policy work in the fall. Still, it made no mention of resuming consultations on the change to its stress test for uninsured mortgages, a vital component of the regulator’s B-20 guideline. If the new rules had been implemented, it is estimated that the qualifying rate floor would be roughly 4.09% rather than the new rate of 4.79%.

Several factors, in addition to low interest rates, have contributed to the housing market surge. Having spent so many months working from home, many people are looking for more space. With a significant number of businesses announcing that telecommuting will be the new normal, at least most of the time, buyers are moving to more remote suburban locations where their dollars buy more space. This has been reflected in the slowdown in the condo market. This is not just a Canadian phenomenon but is evident in the US and parts of Europe as well.

Despite the surprising strength in homebuying during COVID, CMHC continues to blast warnings.

CMHC Wants To Expose The “Dark Economic Underbelly”

Yesterday, Evan Siddall, the CEO at the Canada Mortgage and Housing Corp, published an August 10 letter to the financial industry imploring lenders to “reconsider” offering mortgages to highly leveraged households, saying excessive borrowing will worsen the pain of the coming economic adjustment. Evan Siddall said the Crown corporation had lost market share due to restrictions it imposed on high-risk borrowers earlier this summer. Private mortgage insurers have picked up that business, weakening CMHC’s position and threatening the agency’s ability to protect the mortgage market in the event of a crisis, he said.

CMHC continues to project that house prices will fall later this year, and next, “once government income supports unwind, bankruptcies increase and unemployment starts to bite.” A highlighted sentence in the letter says, “We don’t think our national mortgage insurance regime should be used to help people buy homes with negative equity. But by offering 95 percent loan-to-value mortgages subject to a 4 percent capitalized insurance fee in the midst of an economic calamity, that’s what insurance providers are doing.” Siddall, who steps down from his position at the end of the year, goes on to say that we risk exposing too many people to foreclosure. 

CMHC announced in June it would narrow eligibility criteria to require higher credit scores and lower debt burdens to qualify for a mortgage. The move, which took effect on July 1, was intended to protect new home buyers from falling prices and reduce taxpayer risk to any market correction.

We have sustained a reduction in our market share to promote a more competitive marketplace for your benefit,” Siddall said in the letter. “However, we are approaching a level of minimum market share that we require to be able to protect the mortgage market in times of crisis. We require your support to prevent further erosion of our market presence.”

CMHC’s private-sector competitors, Genworth MI Canada Inc. and Canada Guaranty Mortgage Insurance Co., opted not to follow along with the rule changes and have increased their market share, as a result, said Siddall.

Siddall concluded with two requests for lenders: “We would hope you would reconsider highly leveraged household lending. Please put our country’s long-term outlook ahead of short-term profitability. Second, please don’t aggravate the impact by undermining CMHC’s market presence unnecessarily.”

CMHC’s ability to respond effectively in a crisis will be weakened if its market share deteriorates significantly further, he said. “If you want us in wartime, please support us in peacetime.”


Author: Dr. Sherry Cooper, Chief Economist, Dominion Lendinig Centres
Sherry is an award-winning authority on finance and economics with over 30 years of bringing economic insights and clarity to Canadians.

Canadian Economy Recovers Almost Half Its COVID-Induced Loss in May and June

Latest News Kim Stenberg 31 Jul

The Canadian economy bounced back sharply in May and June as Canadian provinces eased lockdown measures.

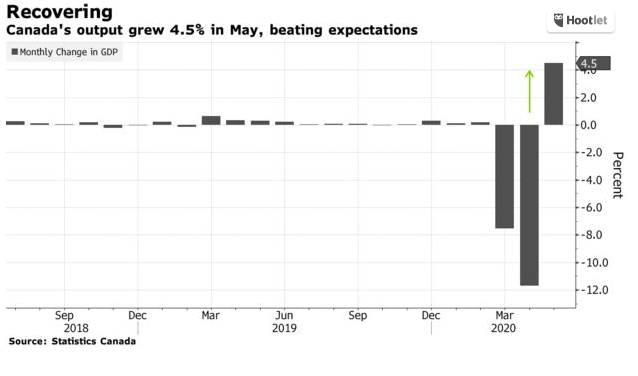
GDP expanded 4.5% in May, and activity in June was even more robust at an estimated 5% rise. Cumulatively, GDP rose 10% in May and June, after plummeting more than 18% in March and April. These figures are calculated on a month-over-month basis.

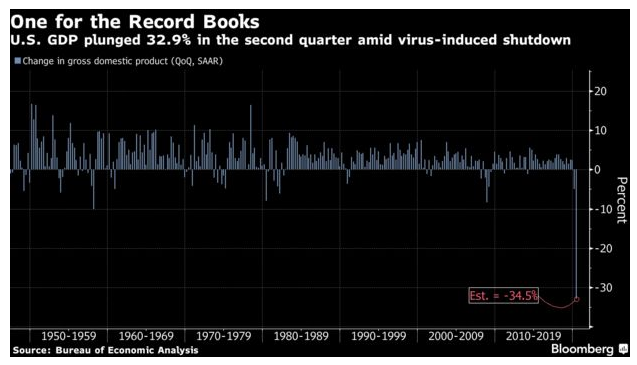
These figures point to about a 40% annual rate decline in second-quarter GDP in Canada, which is roughly in line with economists’ projections. South of the border, the US posted a 33% contraction in GDP for the second quarter, the most massive plunge on record (see details below). It’s not surprising that Canada’s economy tanked by more than the US in Q2, as Canada enacted more aggressive restrictions earlier than the US and eased them more slowly. These public health restrictions were well worth it, as Canada has had far greater success at flattening the curve of new cases and deaths. Moreover, Canada’s economy will likely outpace the US in Q3, showing the benefit of allowing the public health considerations to dominate.

Canadian output was up in most sub-sectors in May, with double-digit monthly gains by retailers coinciding with the reopening of many stores. Construction, too, recorded a strong rebound, with activity up 17.6% month-over-month in the sector.

Activity at food services and bars rose 35.1% in May as dining rooms and patios began to open in certain parts of the country, while other restaurants continued relying exclusively on take-out and delivery. Meanwhile, accommodation services dropped 2.3%, as ongoing restrictions on international and interprovincial travel kept most Canadians at home.

Real estate and rental and leasing increased 1.5% in May following a 3.4% decline in April. Activity at the offices of real estate agents and brokers jumped 57.1% in the month, as home resale activity in nearly all major urban centres increased in conjunction with a substantial increase in the number of newly listed homes. Nevertheless, the output of real estate agents and brokers remained 44% below February’s level.

Arts, entertainment, and recreation declined another 2.9%. We expect some of these services industries to continue to lag the recovery as demand will be slow to rise due to remaining safety protocols and concerns about virus spread.

Oil production remained sluggish in May, down another 2.7% from April and drilling activity has yet to show signs of a significant rebound into the summer.

US ECONOMY SHRINKS AT A RECORD 32.9% PACE IN Q2

US gross domestic product shrank 9.5% in the second quarter from the first, a drop that equals an annualized pace of 32.9%, the Commerce Department’s initial estimate showed on Thursday. That’s the steepest annualized decline in quarterly records dating back to 1947. The drop in GDP in the quarter was close to expectations but was still alone more than twice the total 6-quarter peak-to-trough decline in the 2008/09 recession.

Consumer spending, which makes up about two-thirds of GDP, slumped an annualized 34.6%, also the most on record. While employment, spending and production have improved since reopenings picked up in May and massive federal stimulus reached Americans, a recent surge in infections has tempered the pace of the recovery.

US Jobless Claims

A separate report Thursday showed the number of Americans filing for unemployment benefits increased for a second straight week. Initial claims through regular state programs rose to 1.43 million in the week ended July 25, up 12,000 from the prior week, the Labor Department said. There were 17 million Americans filing for ongoing benefits through those programs in the period ended July 18, up 867,000 from the prior week.

While the economic restart has helped put 7.5 million Americans back to work in May and June combined, payrolls are down more than 14.5 million from their pre-pandemic peak.

“We have seen some signs in recent weeks that the increase in virus cases, and the renewed measures to control it, are starting to weigh on economic activity,” Fed Chairman Jerome Powell said at a news conference Wednesday after the central bank’s two-day policy meeting. “On balance, it looks like the data are pointing to a slowing in the pace of the recovery,” though it was too soon to say how extensive — or sustained — this period would be, he said. This is a reminder that there are limits to how much the economy can rebound to a ‘new normal’ in the absence of a vaccine or more effective treatments.

According to Bloomberg News, The US economy has stalled for the fourth consecutive week as new virus cases continue to surge and some lockdown measures have been reinstated. In the week ending July 24, we saw a decline in US public transit ridership, airline passengers, mortgage applications, consumer confidence, and same-store sales.

With the election only three months away, American voters will have to decide whether to re-elect President Donald Trump to a second term against a backdrop of the virus-induced recession and his response to the health crisis. Not surprisingly, Donald Trump floated the idea of delaying the election in a tweet yesterday morning, suggesting once again the false claim that widespread mail-in voting would make the election “inaccurate and fraudulent.” The president has no power to postpone or cancel an election on his own, and his comment triggered a hugely negative response from both his own party and the Democrats. 

In the meantime,a $600 weekly supplement to unemployment benefits that has provided a key economic lifeline for millions of Americans ends today with Republicans and Democrats still quarrelling over a path forward. This, while US coronavirus deaths now top 152,000, hitting records in Texas and Florida and Dr. Anthony Fauci warns that the disease is spreading rapidly to the Midwest.

BOTTOM LINE

The Canadian economy is outpacing the US in the early recovery period.

Some of the initial bounce-back in Canada – particularly in the housing market – probably reflects the release of pent-up demand generated during the lockdown. Unprecedented income supports have also helped prop up near-term household purchasing power. Payments from CERB alone looked larger than total wage losses through the downturn in April, and we expect to see more of the same in May payroll employment and wage numbers in the week ahead.

The threat of a resurgence in virus spread will still limit the amount that the economy can recover over the second half of this year – and activity in the oil and gas sector still looks exceptionally soft. We still expect GDP to be more than 5% below year-ago levels, and the unemployment rate elevated, in Q4. But there is some scope for Canada to outperform the US in the very near-term, provided virus spread can remain relatively well contained.

According to early advance data for July published by RBC economics, retail and recreation activity in Canada continues to recover more quickly than in the US states suffering surging COVID cases (see chart below).

Credit:  Dr. Sherry Cooper, Chief Economist, Dominion Lending Centres
Sherry is an award-winning authority on finance and economics with over 30 years of bringing economic insights and clarity to Canadians.

CANADIAN HOME SALES AND NEW LISTINGS RECOVER ONE-THIRD OF PANDEMIC LOSS IN MAY

Latest News Kim Stenberg 15 Jun

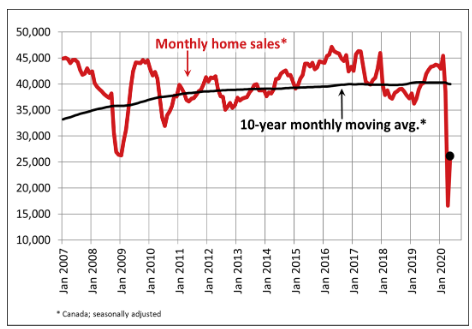
THERE WAS GOOD NEWS TODAY ON THE HOUSING FRONT. Home sales surged by a record 56.9% in May from April’s unprecedented collapse. Data released this morning from the Canadian Real Estate Association (CREA) showed national home sales recovered roughly one-third of the COVID-induced loss between February and April (see chart below). On a year-over-year (y-o-y) basis, sales activity was still down almost 40%, but the jump in sales and an even larger surge in new listings shows pent-up demand remains for housing as buyers wish to take advantage of historically low mortgage rates.

Transactions were up on a month-over-month (m-o-m) basis across the country. Among Canada’s largest markets, sales rose by 53% in the Greater Toronto Area (GTA), 92.3% in Montreal, 31.5% in Greater Vancouver, 20.5% in the Fraser Valley, 68.7% in Calgary, 46.5% in Edmonton, 45.6% in Winnipeg, 69.4% in Hamilton-Burlington and 30.5% in Ottawa. Not surprisingly, the cities with the smallest gains posted the smallest declines in prior months.

More importantly, anecdotal data suggest that housing activity has been steadily rising from the middle of April until the first week in June.

NEW LISTINGS

The number of newly listed homes shot up by a record 69% in May compared to the prior month with gains recorded across the country.

With new listings having recovered by more than sales in May, the national sales-to-new listings ratio fell to 58.8% compared to 63.3% posted in April. While this statistic has moved lower, the bigger picture is that this measure of market balance has been remarkably stable considering the extent to which current economic and social conditions are impacting both buyers and sellers.

There were 5.6 months of inventory on a national basis at the end of May 2020, down from 9 months in April. The temporary jump in this measure recorded in April reflected the fact that sales were expected to fall right away amid lockdowns; whereas, other variables like active listings would be expected to fall at a much slower pace. The CREA report suggests many sellers who already had homes on the market before mid-March may have left the listings up for now but drastically curtailed the extent to which they were showing their homes during the lockdown. With many of those now coming off the market, overall active listings have fallen by about a quarter as of the end of May, bringing them down among the lowest levels on record for that time of the year.

HOME PRICES

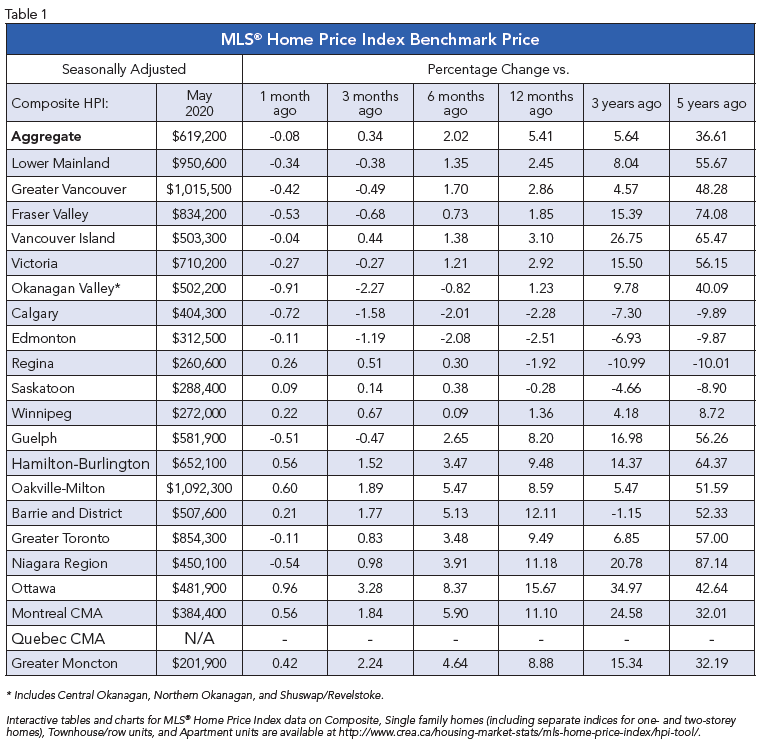
Home prices were little changed in May compared to April across Canada. Of the 19 markets tracked by the MLS Home Price Index (HPI), 18 recorded either m-o-m increases or smaller decreases than in April. Five markets posted price gains in May following a decline in April (see the table below for local details).

In general, since the pandemic crisis began small declines in prices have been posted in British Columbia while declining trends already in place in Alberta have accelerated. With the recent surge in oil prices, however, sales activity has actually improved across the Prairies and price trends have been stabilizing.

Despite the pandemic, home prices in the Greater Golden Horsehoe area around and including Toronto have fallen very little and remain well above year-ago levels. In Ottawa, Montreal and Moncton, prices have continued to climb, albeit at a slower pace than before.

BOTTOM LINE

CMHC has recently forecast that national average sales prices will fall 9%-to-18% in 2020 and not return to yearend-2019 levels until as late as 2022. I continue to believe that this forecast is overly pessimistic. Firstly, average sales prices are highly misleading, especially on a national basis because they vary so much depending on the location of the activity, as well as the types of property sold.

There is no national housing market. All housing markets are local. A glance at Table 1 above shows a wide variation in regional sales price action, but if anything, trends appear to be converging on moderate positive pressure on prices. Today’s economic recession is like no other. The record stimulus introduced by the Bank of Canada and the federal government will assure that the housing markets will continue to function, even with social-distancing measures in place, and those who enjoy steady employment will proceed in due course with regular housing decisions.

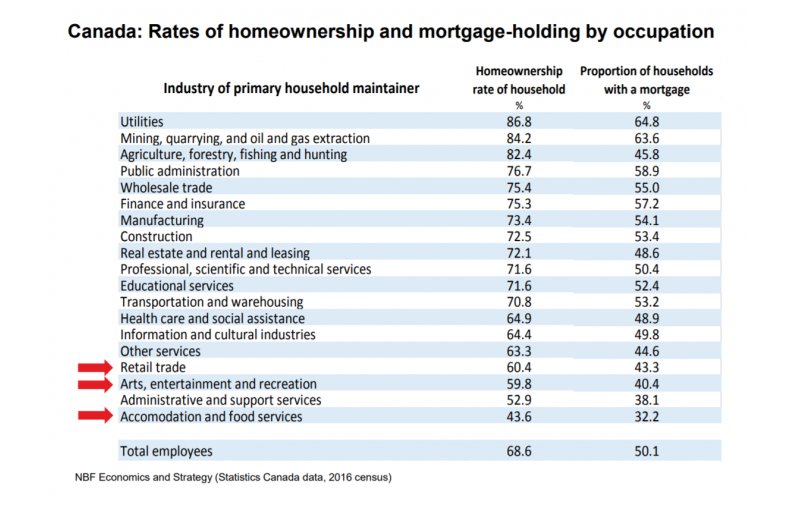
Those who permanently lose their jobs are the real concern. Many of those people will be in the hardest hit and slowest-to-recover sectors of our economy, such as hospitality (accommodation and food), non-essential retail trade, and the leisure industry (arts, entertainment and recreation). Statistics Canada census data for 2016 in the table below, shows that the homeownership rate in these sectors is relatively low. Unfortunately, most of those who will be hardest hit by the pandemic can least afford it. This is an issue that fiscal policy must address, investing in retraining programs and universal income guarantees.

Author:  Dr. Sherry Cooper
Chief Economist, Dominion Lending Centres
Sherry is an award-winning authority on finance and economics with over 30 years of bringing economic insights and clarity to Canadians.

CMHC Makes it Harder to Qualify for an Insured Mortgage

Latest News Kim Stenberg 5 Jun

CMHC Makes It Harder To Qualify For An Insured Mortgage

Once again, the Canadian Mortgage and Housing Corporation (CMHC) is tightening the criteria to get a mortgage with less than a 20% down payment. Any potential home buyer with less than a 20% down payment must purchase default insurance on their loan and have a minimum down payment of 5%. CMHC is a federal Crown Corporation that provides such default insurance. Its mandate is to help Canadians access affordable housing options. Providing mortgage insurance to home buyers is one of its main activities. Mortgage default insurance protects lenders in the event a borrower ever stopped making payments and defaulted on their mortgage loan–a very infrequent occurrence in Canada.

There are private providers of default insurance as well–Genworth Financial Canada and Canada Guaranty. CMHC is the only insurer of mortgages for multi-unit residential properties, including large rental buildings, student housing and nursing and retirement homes. It is the largest provider of mortgage default insurance by far and is also the primary insurer for housing in small and rural communities.

Investment properties are not eligible for mortgage insurance. Because of this, the buyer needs at least a 20% down payment to buy an investment property. Homes costing more than $1 million, as well, are not eligible for mortgage insurance. Typically, the lender chooses the mortgage insurer.

Why is CMHC Tightening Qualifications?

The economics team at CMHC has predicted that owing to the pandemic lock down, home prices will likely fall by 9% to 18% over the next 12 months. They also believe that it will take at least two years for prices to return to pre-pandemic levels. The CMHC forecast for the economy is more pessimistic than many other forecasts, particularly that of the Bank of Canada, which asserted yesterday that the outlook for the economy was better than their April forecast suggested. Moreover, CMHC acknowledges the high degree of uncertainty associated with any forecast at this time. The Crown Corporation highlights the post-shutdown job losses, business closures and the drop in immigration that adversely affect Canadian housing.

They also have emphasized the 15% of existing mortgages that are now in deferral and believe there is a risk that 20% of all mortgages could be in arrears when deferrals end. Their stated justification for tightening qualification requirements is “to protect future home buyers and reduce risk“.

What Are These Changes In Underwriting Policies

Effective July 1, the following changes will apply for new applications for homeowner transactional and portfolio mortgage insurance:

  • The maximum gross debt service (GDS) ratio drops from 39 to 35
  • The maximum total debt service (TDS) ratio drops from 44 to 42
  • The minimum credit score rises from 600 to 680 for at least one borrower
  • Non-traditional sources of down payment that increase indebtedness will no longer be treated as equity for insurance purposes

CMHC goes on to say that “to further manage the risk to our insurance business, and ultimately taxpayers, during this uncertain time, we have also suspended refinancing for multi-unit mortgage insurance except when the funds are used for repairs or reinvestment in housing. Consultations have begun on the repositioning of our multi-unit mortgage insurance products.”

Here’s What We Know So Far

Anecdotal reports suggest that it is likely that private default insurers will not match CMHC’s lower debt ratios. They might, however, be more selective in their approval processes.

Canadian fiscal and monetary authorities are expending huge sums to keep the economy afloat, cushion the blow of the shutdown, and to make sure ample credit is available. These actions are intended to minimize unnecessary insolvencies. It is, therefore, surprising that a federal Crown Corporation would take these pro-cyclical actions now.

The exact impact of these changes will not be known until more details are available: How the Big Banks will respond with their own prime mortgage underwriting rules; how these new rules will apply to the securitization market; and how far the private default insurers will go along with these new rules.

Suffice it to say that this batters buyer and seller confidence and, all other things equal, has a net negative impact on the near-term housing outlook.  Most importantly, in my view, these changes are unnecessary to protect the prudence of Canada’s home lending practices. Mortgage delinquency rates are meager, and even the Bank of Canada’s forecast is for delinquencies to remain less than 1% of all outstanding mortgages. Moreover, home buyers with jobs who meet former qualifications would undoubtedly have a longer than two-year time horizon when buying their first homes. They were already qualifying at the posted rate that is more than 250 basis points above the contract rate. If anything, the pandemic recession assures that interest rates will remain very low over the next two years.

Author:  Dr. Sherry Cooper, Chief Economist for Dominion Lending Centres


Bank of Canada Holds Rate Steady

Latest News Kim Stenberg 3 Jun

Bank of Canada Takes A More Positive Tone

On the heels of a devastating decline in the Canadian economy, the Bank of Canada suggested today that the worst of the pandemic’s negative impact on the global economy is behind us, conceding, however, that uncertainty remains high. The Bank today maintained its target overnight rate at 0.25%. No additional rate cut was expected as the  Bank has described the 0.25% level as the effective lower bound of the policy rate. Governor Poloz has all but ruled out negative interest rates unless the economy deteriorates dramatically further.

Today’s Governing Council meeting is Stephen Poloz’s swan song, as the new Governor, Tiff Macklem, takes the helm today. Macklem took part as an observer in the Governing Council’s deliberations and endorsed today’s rate decision and measures announced in the press release, thereby assuring continuity in monetary policy.

The Bank has taken very aggressive action to support liquidity and the full functioning of financial markets by buying short- and long-term securities. The central bank’s balance sheet holdings of securities have grown to about 20% of Canada’s GDP, up from 5% pre-crisis. That’s still well below the levels seen at the US Federal Reserve, the Bank of Japan, and the European Central Bank, which have conducted these quantitative easing operations since the financial crisis more than a decade ago. However, the Bank of Canada’s securities purchases have been extraordinary in relation to the size of our economy.

“Decisive and targeted fiscal actions, combined with lower interest rates, are buffering the impact of the shutdown on disposable income and helping to lay the foundation for economic recovery.” According to the central bank, the Canadian economy appears to have avoided the most severe scenario presented in the Bank’s April Monetary Policy Report (MPR).

The level of real GDP in Q1 was 2.1% below the level in the fourth quarter of 2019. The Bank of Canada is now predicting that real GDP in Q2 will likely post a further decline of 10%-to-20%, as continued shutdowns and sharply lower investment in the energy sector take an additional toll on output. That suggests a peak-to-trough decline of 12% to 22%, instead of the 15% to 30% scenario the central bank had previously been estimating. “The Canadian economy appears to have avoided the most severe scenario,” the Bank of Canada said.

Bottom Line: While the degree of uncertainty remains high, there is evidence that the worst of the economic downturn is behind us. Preliminary data for May suggests that home sales picked up on a month-over-month basis in May in the GTA and GVA, although home sales continued to be down significantly from levels one year ago. 

Some people are concerned that the extraordinary stimulus in monetary and fiscal measures in recent months might, in time, be inflationary. Governor Poloz has made it clear that the dire results of the economic shutdown would have been highly deflationary had these actions not been taken. Deflation, coupled with high debt levels, would have triggered a depression. Economic models are ill-equipped to deal with the fallout of the pandemic. Policymakers need to be nimble in responding, and when the economy has recovered sufficiently, they will begin the unwinding of all of this stimulus, which will require an equally deft response on both the fiscal and monetary side.


Credit:  Dr. Sherry Cooper, Chief Economist for Dominion Lending Centres


Lockdowns Hit Canadian Q1 GDP

Latest News Kim Stenberg 29 May

Near-Record Decline in Q1 GDP Better Than Flash Estimate

The hand-wringing about the Q1 GDP data released today misses the point that the data were actually better than expected. The Canadian economy declined at an 8.2% annualized rate in the first quarter, less harsh than the earlier estimate by StatsCan of -10%. Of course, every sector of the economy was hit by the enforced shutdown, but not by nearly as much as most economists anticipated. For the month of March, the decline was 7.2%, less dire than the -9% earlier estimate.

In light of the current unprecedented national and global economic environment, StatsCan is providing leading indicators of economic activity. Their preliminary flash estimate for April is an 11% decline in real GDP. This estimate will be revised as more info becomes available, but the March and April decreases are likely to be the largest consecutive monthly declines on record.
The Economy Has Bottomed

It looks increasingly likely that we are already past the bottom of the latest economic downturn, with GDP potentially getting back on a positive growth trajectory as early as May.

That won’t be enough to prevent a historically large drop in Q2 output– likely multiples of the decline in Q1–but it would leave the data tracking along the more “optimistic” end of the -15% to -30% growth range estimated by the Bank of Canada in their last Monetary Policy Report. Government support programs for those losing work have been unprecedented–household disposable income actually edged up slightly in Q1 despite the large drop in overall economic activity, boosted by government transfers. With the decline in spending in March and April and the rise in disposable income, the savings rate is soaring. All of us are saving money by doing our own cooking and cleaning. We aren’t travelling and shopping is certainly limited, not to mention the savings on gasoline, entertainment, hairstyling and gym memberships. Hopefully, this could provide a cushion to support spending and the economy will turn sharply higher in Q3.

Still, the three million jobs lost over March and April will not be recouped quickly. The lockdown is easing only gradually, and any activities requiring large gatherings–think tourism, conferences, concerts, movies and sports–will remain closed until there is a vaccine or effective treatment. We expect things will begin to get better from this point, but still look for the unemployment rate to remain elevated at 8.5% in Q4 of this year. It is currently 13%.

THE HOUSING OUTLOOK

Much has been made of the recent CMHC Housing Market Outlook report released this week. The gloomy outlook of up to an 18% drop in home prices, a delayed recovery not until 2022, and a 20% arrears rate garnered headlines. First-time homebuyers were warned that housing was no longer a good investment, at least not over a three-year horizon. But the CMHC’s own data shows that home prices have risen an average of 5% annually over the past twenty-five years. And though no one’s retirement nest egg should consist solely of their residential real estate, a home is one of the few investments that you can actually use. People buy homes for many reasons well beyond wealth accumulation. The pride of ownership and lifestyle choice dominates the decision to buy for many.

Also this week, the Governor of the Bank of Canada suggested that the doomsters were overly pessimistic and asserted his view that the economy would recover from its medically induced coma much faster than the pessimists were suggesting. Clearly, none of us have a crystal ball, nor have we ever before experienced a pandemic recession. While we rise from the abyss, the pain may well be far from over. People are still losing jobs and many businesses continue to sink. Any recovery is dependent on whether the virus cases keep slowing and whether there is a second wave of infections.

But oil prices have risen sharply, a major boon for Alberta and some high-frequency data have improved. The stock market is well off its lows, interest rates have fallen sharply and the qualifying rate for mortgage stress tests has fallen to 4.94%. Actual mortgage rates are near record lows and are likely to remain low for the foreseeable future.

In time, immigration to Canada will restart, and foreign students will return. New businesses are blossoming even now and many sectors will continue to advance. To name a few, we are seeing burgeoning growth in telemedicine, artificial intelligence, big data analysis, cloud services, cyber-security, 5G, home entertainment, virtual everything, home fitness, DYI renovations, indeed, DIY anything.


Credit:  Dr. Sherry Cooper
Chief Economist, Dominion Lending Centres