
 Statistics released today by the Canadian Real Estate Association (CREA) show home sales were up 1.3% on a month-over-month basis in October. Still, monthly activity remained a whopping 36% below the October pace in 2021. The housing correction continues in response to the Bank of Canada’s massive rate hikes, but the speed of the correction is slowing.
“October provided another month’s worth of data suggesting the slow down in Canadian housing markets is winding up,” said Shaun Cathcart, CREA’s Senior Economist. “Sales actually popped up from September to October, and the decline in prices on a month-to-month basis got smaller for the fourth month in a row.”
You can see from the chart below just how slight the uptick in October home sales was, but at this stage, it shows that a housing crash is not occurring.
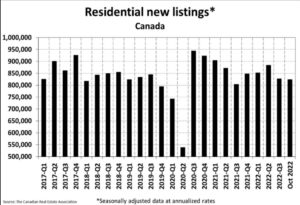
New Listings
The number of newly listed homes was up 2.2% on a month-over-month basis in October, with gains in the Greater Toronto Area (GTA) and the B.C. Lower Mainland offsetting declines in Montreal and Halifax-Dartmouth.
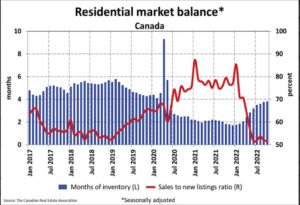
With sales up by a little less than new listings in October, the sales-to-new listings ratio fell to 51.6% compared to 52% in September. The long-term average for this measure is 55.1%.
There were 3.8 months of inventory on a national basis at the end of October 2022, up slightly from 3.7 months at the end of September. While the number of months of inventory is still well below the long-term average of about five months, it is also up quite a bit from the all-time low of 1.7 months set at the beginning of 2022.
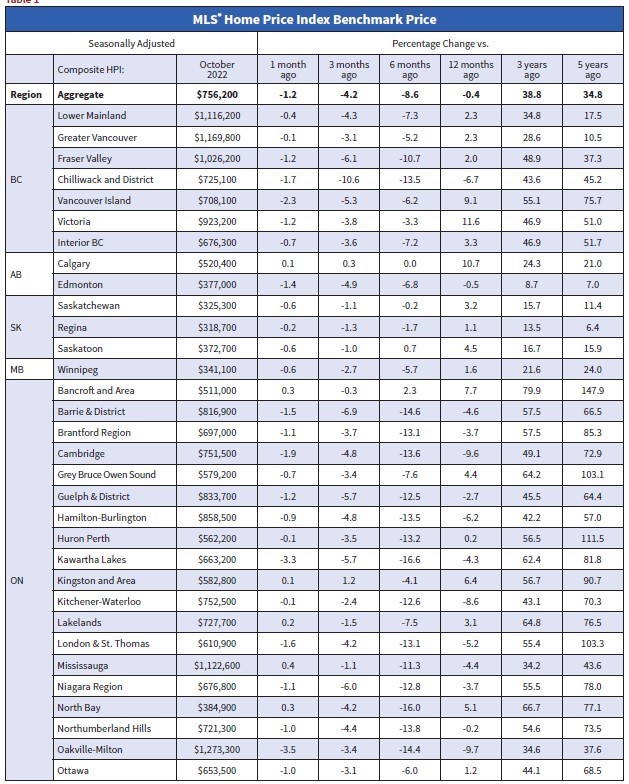
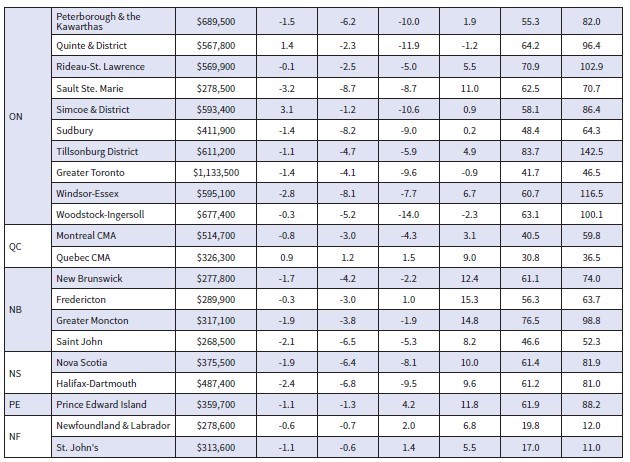
Home Prices
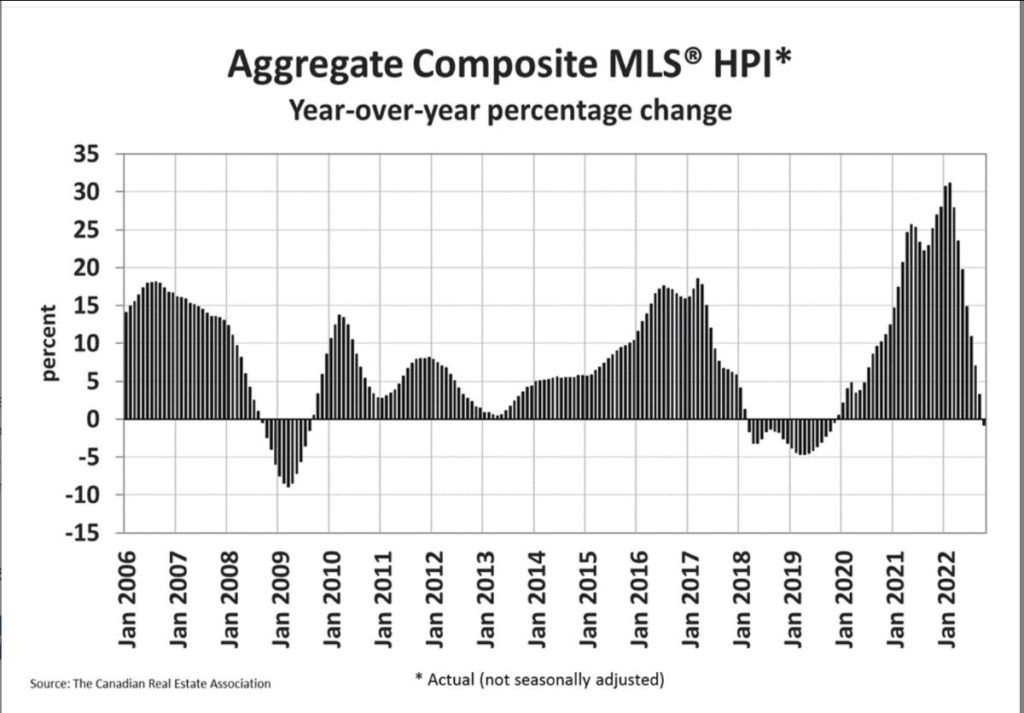
The Aggregate Composite MLS® Home Price Index (HPI) edged down 1.2% month-over-month in October 2022, the smallest decline since June.
The national average transactions price fell 9.9% y/y in October, while the MLS HPI dipped 0.8% y/y with downward momentum continuing on a month-to-month basis. The HPI is now down eight months or an even 10% from the February high. With mortgage rates across the spectrum pushing above 5% as the Bank of Canada tightens further, this downward price discovery will probably persist well into next year.
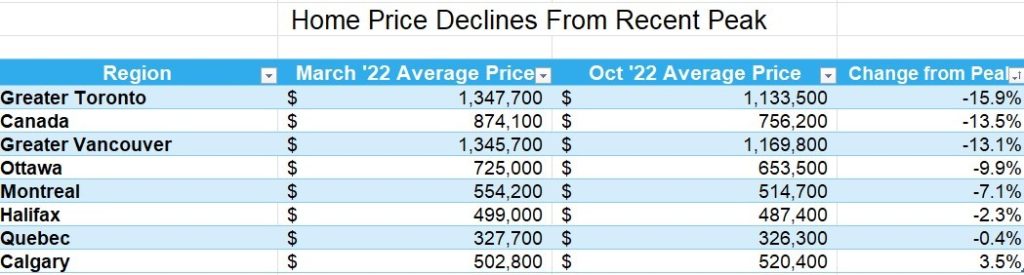
In Ontario, for example, the sales-to-new listings ratio has weakened to just above the 40% level. In some markets outside the core of the GTA, benchmark prices are easily down 15%-to-20% from their early-year highs already. It’s a similar situation in B.C. where, while Vancouver is correcting, markets 1-to-2 hours outside the core are doing so even faster—none of this is a surprise given how sharply these exurban markets ballooned during the pandemic. Meantime, Atlantic Canada is holding up relatively well thanks to an ongoing population influx, while Alberta (and the Prairies more broadly) still look pretty solid.
The table below shows the decline in average home prices in Canada and selected cities since prices peaked in March when the Bank of Canada began hiking interest rates. More details follow in the second table below. The largest price dips are in the GTA and the GVA, where the price gains were spectacular during the COVID-shutdown.
Bottom Line
The Bank of Canada slowed its tightening pace to 50 bps when it met in late October. Since then, the US inflation has slowed a bit, causing longer-term bond yields to fall meaningfully. Tomorrow, Canada will release its latest inflation report. All eyes will focus on core inflation (which excludes food and energy prices) in the hopes that evidence will also validate a slowdown in those measures.
The Bank of Canada’s policy announcement date is not until December 7th, when another rate hike is widely expected. Tomorrow’s inflation report will give us a better sense of whether a 25-bps hike might be possible.